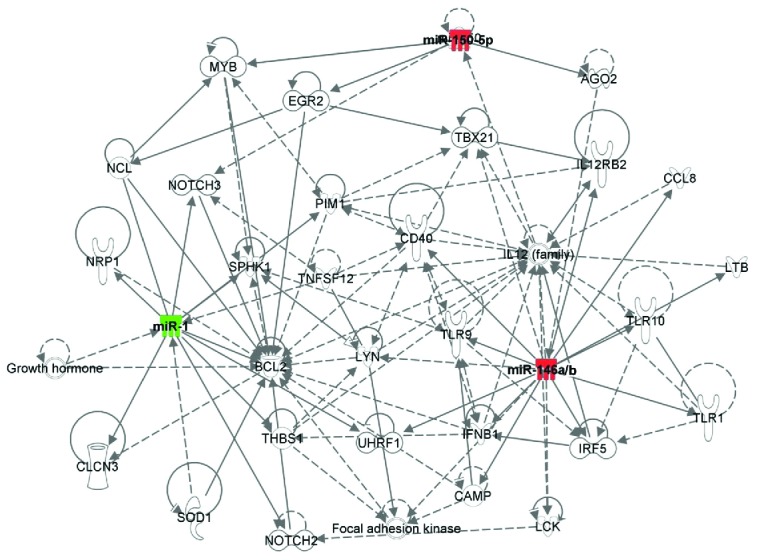
Figure 5.

Ingenuity Pathway Analysis (IPA) to identify immune targets of the selected three microRNAs (miRNAs). Shown are network genes of the dysregulated 3 miRNAs (miR-1, miR-146b-5p, and miR-150-5p) in aplastic anemia (AA) plasma, compared to healthy control (HC). Color intensity indicates upregulation (red) and downregulation (green). Solid and dotted lines represent direct and indirect relationships between genes.
