
Figure 2.
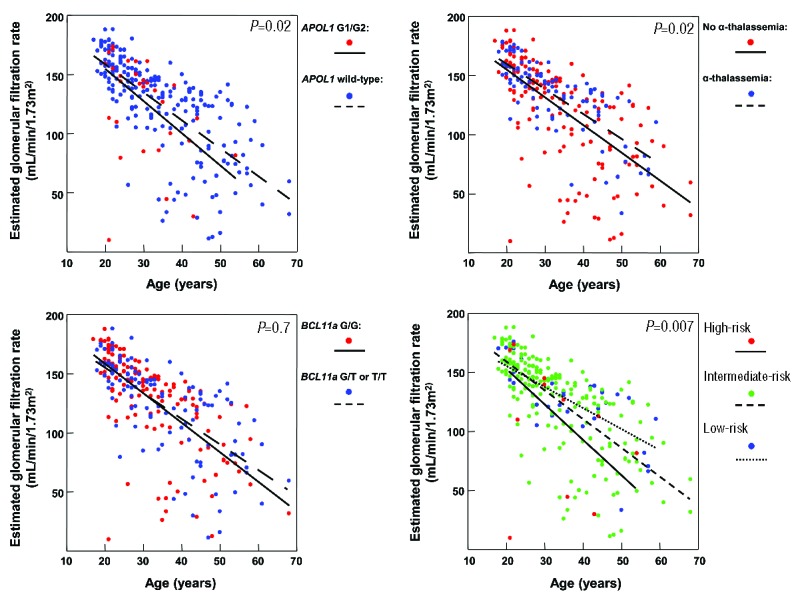
Linear regression relationship of eGFR (estimated glomerular filtration rate) with age by genotype. Individuals with APOL1 G1/G2 (β=−12.6, 95% CI: −23.6 to −1.7), absence of α-thalassemia (β=−8.8, 95% CI: −15.9 to −1.7), and wild-type BCL11A rs1427407 (β=−2.2, 95% CI: −9.2 to 4.8) had lower eGFR than individuals with wild-type APOL1, α-thalassemia, and BCL11A rs1427407 T variant, respectively, although none of the associations were statistically significant after the Bonferroni correction. The genetic profile identified individuals with progressively lower eGFR (β=−11.7, 95% CI: −20.1 to −3.3). Linear regression lines by genetic variant or genetic risk profile are provided in the figures.