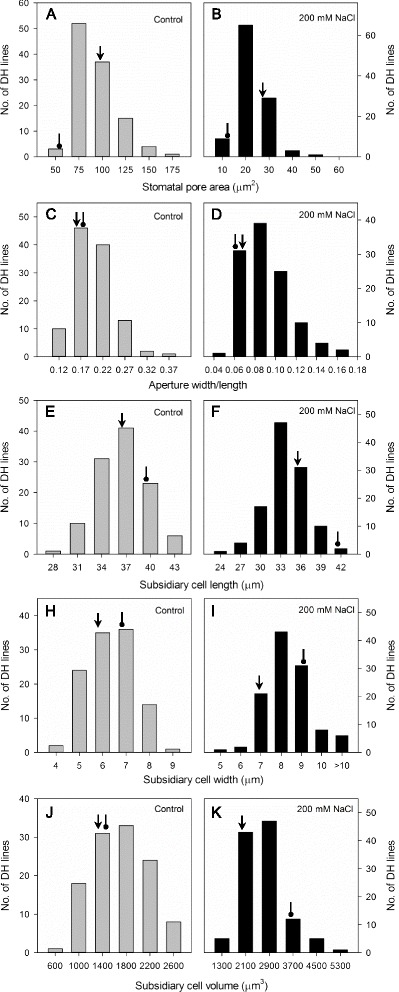
Fig. 2.

Frequency distribution of stomatal traits in control and salt treatment. Shown are stomatal pore area (a, b), aperture width/length (c, d), subsidiary cell length (e, f), subsidiary cell width (h, i) and subsidiary cell volume (j, k) of DH lines derived from the cross of CM72 and Gairdner, under control and salinity treatment conditions. Arrow represents CM72 and oval arrow represents Gairdner. Data are averages of 16–73 cells from 4 replicates
