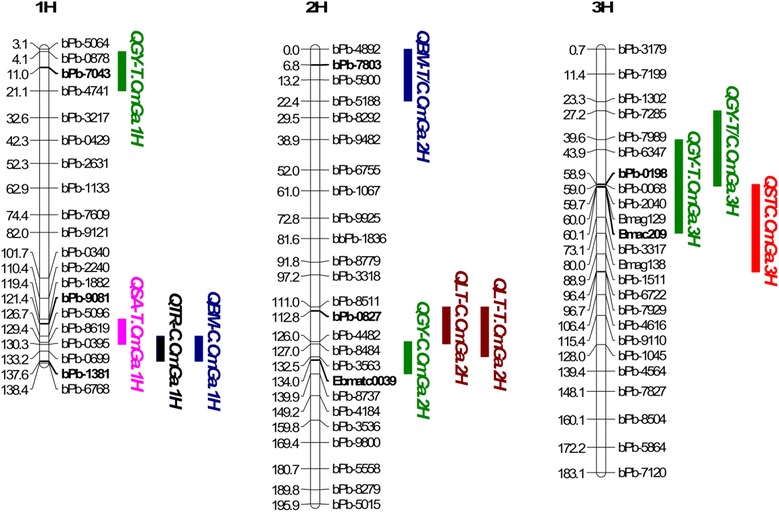
Fig. 4.

QTLs associated with salinity tolerance (in red), grain yield (in green), biomass (in blue), stomatal area (in pink), transpiration rate (in black) and temperature of leaves (in brown). For clarity, only part of the chromosome regions which cover 2-LOD interval of all the QTLs are shown. C: Control; T: salt treatment
