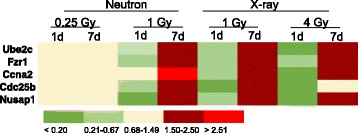
Fig. 4.

Heatmap illustrating relative expression of cell cycle genes bi-directionally regulated after neutron and x-ray irradiation. The mean (n = 6) fold change in gene expression relative to controls is color coded according to the scale bar at the bottom of the figure. Measurements were made by microarray analysis
