
Fig. 5.
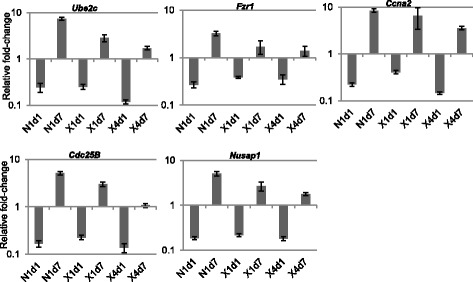
Gene expression measured by qRT-PCR. Expression of five genes (Ube2c, Fzr1, Ccna2, Cdc25b, and Nusap1) that were shown by microarray analysis to be bi-directionally regulated is depicted relative to controls and normalized to Actb expression. Data represent the mean ± S.E.M. (n = 6). N1d1: 1 Gy neutron, day 1; N1d7: 1 Gy neutron, day 7; X1d1: 1 Gy x-rays, day 1; X1d7: 1 Gy x-rays, day 7; X4d1: 4 Gy x-rays, day 1; X4d7: 4 Gy x-rays, day 7