
Fig. 3.
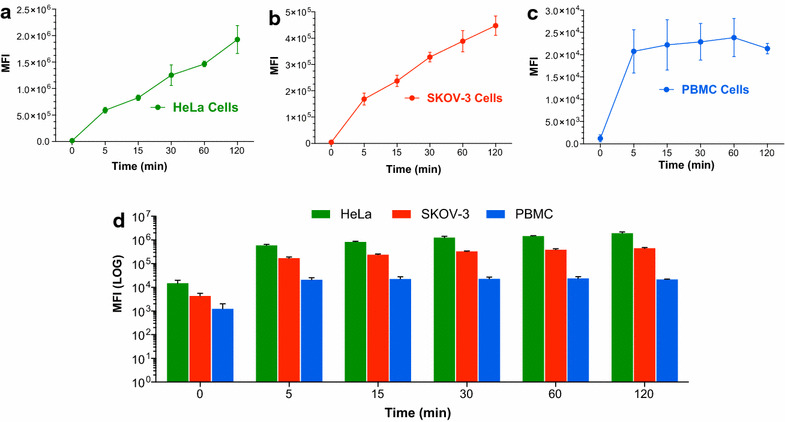
Quantification of the cellular uptake of PHBV nanoparticles. Concentration dependency. To evaluate concentration dependency in the cellular uptake of NPs, HeLa (a), SKOV-3 (b) and PBMC (c) were incubated with a PHBV-RN solution at different concentrations (1, 10, 100, 500 and 1000 µg/mL) for 2 h. d Mean fluorescence intensity analysis of the three different cells. Mean fluorescence intensity was determined through flow cytometry (n = 3)