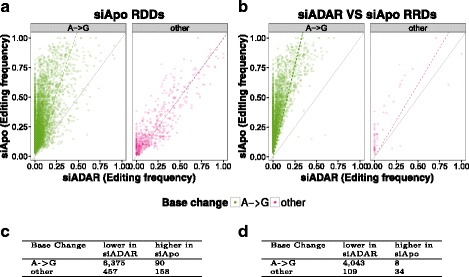
Fig. 8.

Properties of RDDs in HEK-293 cells. a Comparison of editing frequency of siADAR samples and RDDs detected in siAPOBEC3 (siApo) treated cells. (Dashed line(s) correspond(s) to regression line(s)) b Editing frequency of sites that are identified as divergent in RRD comparison of treatments. Tables c + d show details of editing frequencies statistics for scatterplots a and d, respectively
