
Figure 4.
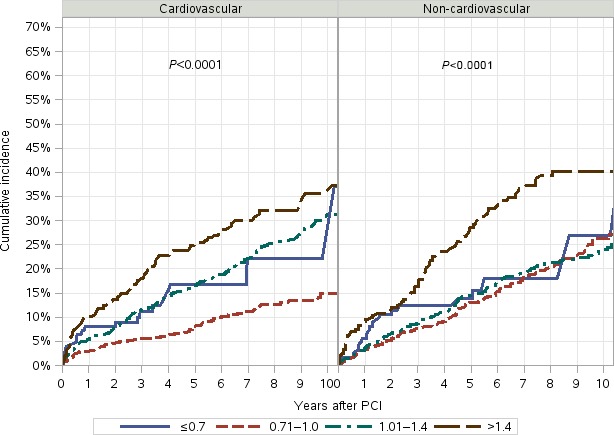
Unadjusted competing risk plots for cardiovascular and noncardiovascular mortality by serum creatinine in patients with normal body mass index. Creatinine levels are shown: Solid blue line: ≤0.7 mg/dL; dashed red line: 0.71 to 1.0 mg/dL; dash‐dot line: 1.01 to 1.4 mg/dL; long‐dash line: ≥1.4 mg/dL. Increased cardiovascular mortality was noted in the first year after PCI, and increased noncardiovascular mortality was noted in the first 2 years after PCI. PCI indicates percutaneous coronary intervention.