
Figure 2.
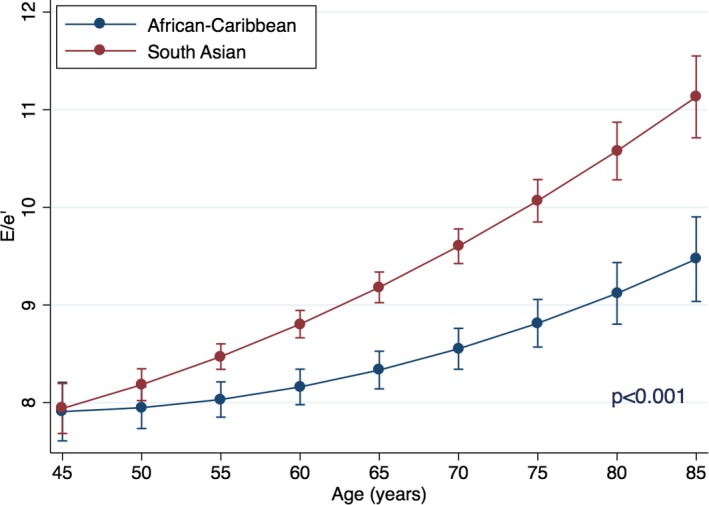
Interactions of age and ethnicity for prediction for E/e′. Point estimates are values of the regression line at age groups categorized by 5‐year increments. Error bars are 95% CIs for the correspondent graph points.
Official websites use .gov
A
.gov website belongs to an official
government organization in the United States.
Secure .gov websites use HTTPS
A lock (
) or https:// means you've safely
connected to the .gov website. Share sensitive
information only on official, secure websites.
Interactions of age and ethnicity for prediction for E/e′. Point estimates are values of the regression line at age groups categorized by 5‐year increments. Error bars are 95% CIs for the correspondent graph points.