
Figure 5.
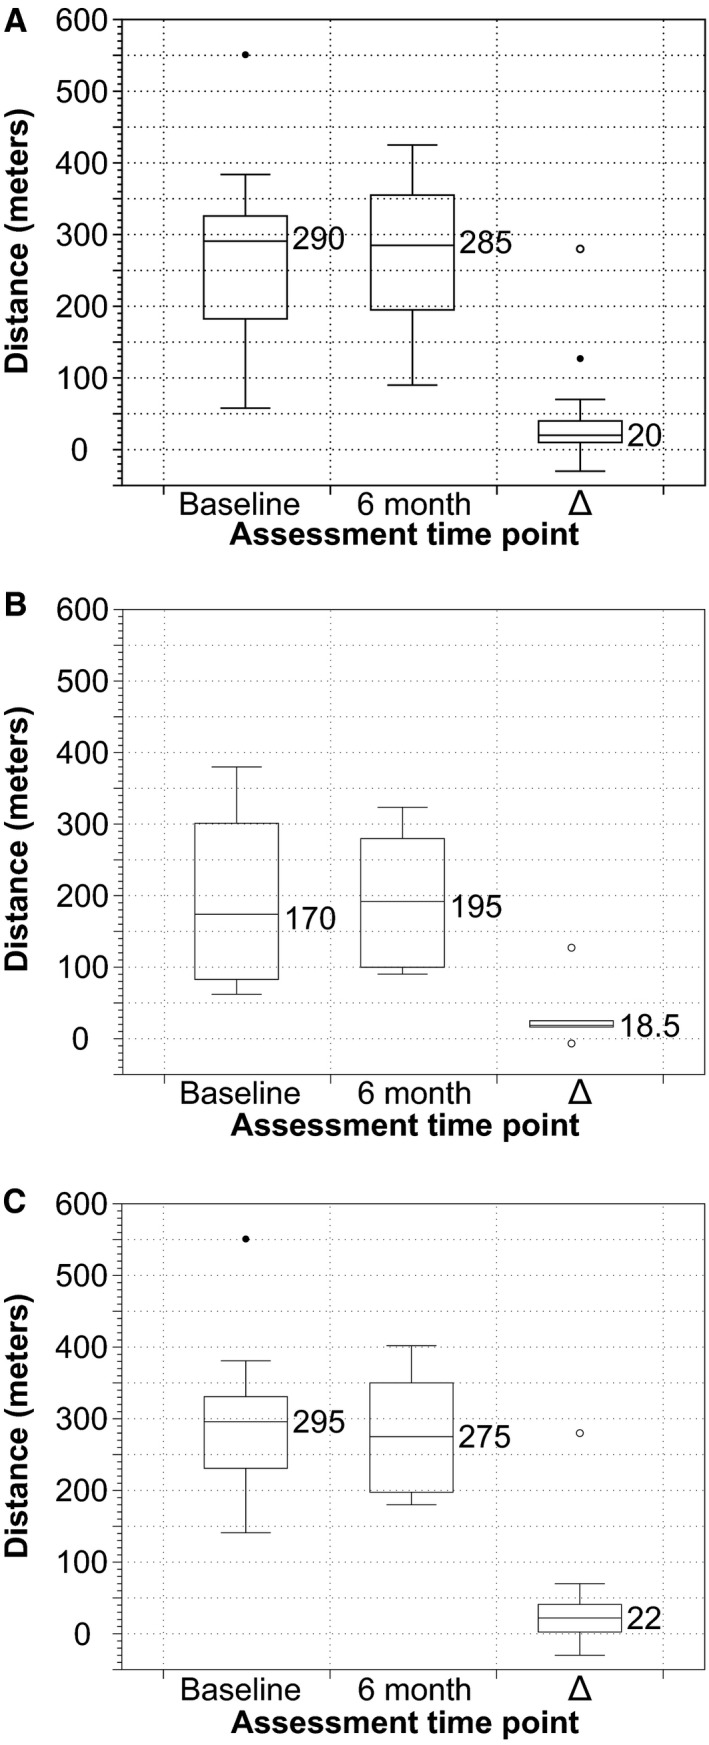
Box‐and‐whisker plots showing the distribution of 6‐minute walk distances at 6 months compared with baseline in (A) total cohort, (B) patients without new DWI changes on postprocedure MRI, and (C) patients with new changes on postprocedure MRI. Δ, 6 month–baseline score/value. DWI indicates diffusion‐weighted imaging; MRI, magnetic resonance imaging.