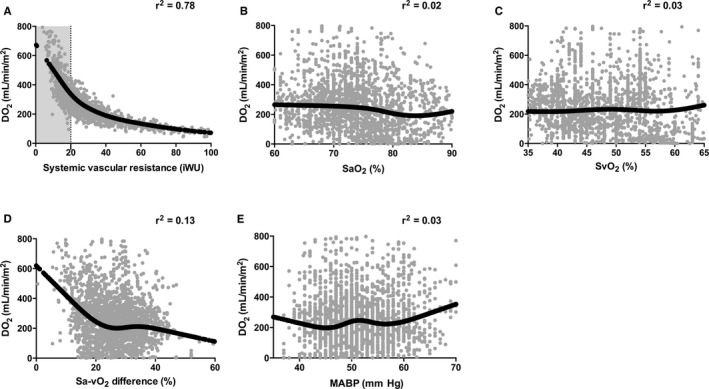
Figure 5.

Relationship of systemic oxygen delivery to (A) systemic vascular resistance, (B) arterial oxyhemoglobin saturation (SaO2), (C) venous oxyhemoglobin saturation (SvO2), (D) arteriovenous oxyhemoglobin saturation (Sa‐vO2) difference, and (E) mean arterial blood pressure for all patients studied in the OxyCAHN study (n=21). Data are hourly median values, black lines represent median spline through predicted values for DO 2. Adjusted r2 is shown for each model. Note that r2 values are not adjusted for repeated measures. MABP indicates mean arterial blood pressure.
