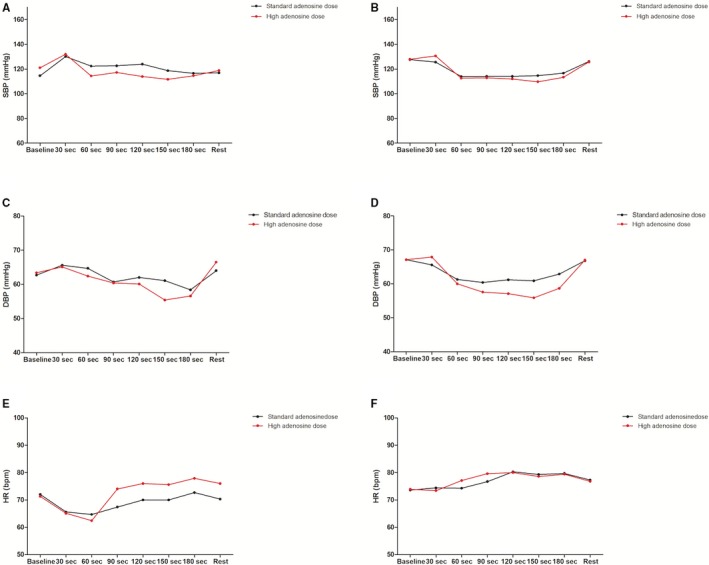
Figure 6.

Hemodynamic measurements by adenosine dose in the quartiles of patients with the greatest (A, C, and E) and lowest (B, D, and F) reduction in Pd/Pa variation. Dots represent means. In A, compared with B, a greater decrease in SBP is observed with the high vs the standard adenosine dose. In (E), compared with (F), a greater increase in HR also is observed with the high vs the standard adenosine dose. DBP behavior with high dose was not different among increasers or decreasers of variation, (C) compared with (D). bpm indicates beats per min; DBP, diastolic blood pressure; HR, heart rate; Pa indicates aortic pressure; Pd, distal coronary pressure; SBP, systolic blood pressure.
