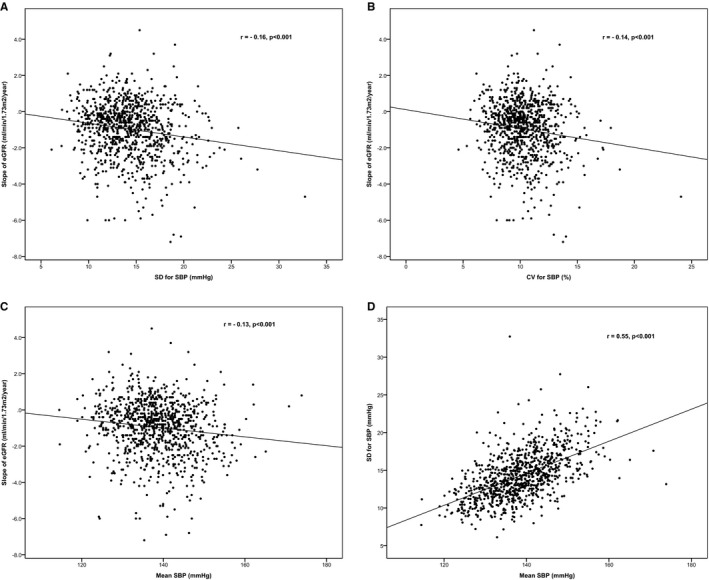
Figure 1.

Relationship between the slope of eGFR, SD, CV, and mean SBP. A, Correlation between slope of eGFR and SD of SBP. B, Correlation between slope of eGFR with CV of SBP. C, Correlation between slope of eGFR with mean SBP. D, Correlation between SD of SBP and mean SBP in patients with hypertension. CV indicates coefficient of variation; eGFR, estimated glomerular filtration rate; SBP, systolic blood pressure.
