
Figure 1.
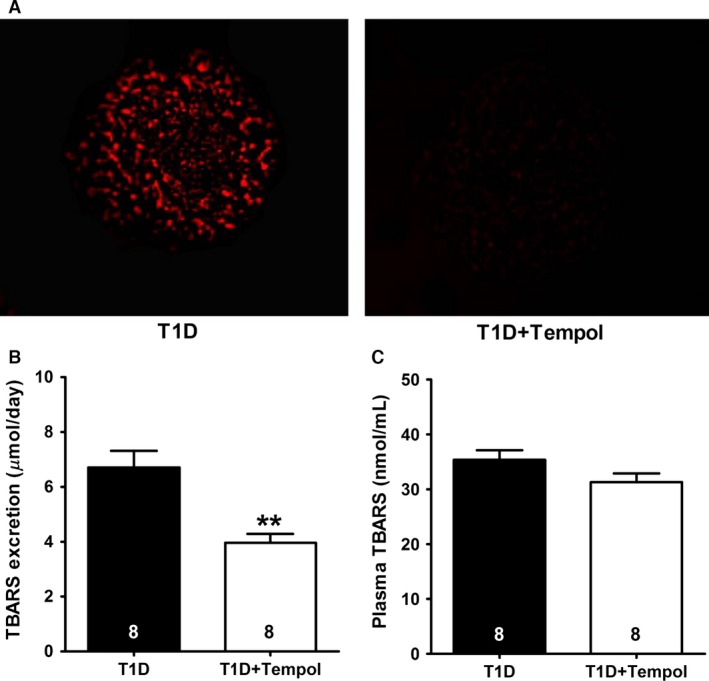
Effect of chronic tempol treatment on oxidative stress indicators in rats with type 1 diabetes mellitus (T1D). (A) Representative images showing dihydroethidium oxidation (red fluorescence), indicative of superoxide production by glomeruli isolated from T1D and T1D+Tempol rats. (B) Urinary excretion of thiobarbituric acid reactive substances (TBARS). (C) Plasma TBARS levels (**P < 0.01 vs. T1D; number of animals shown at bottom of each bar).