
Figure 2.
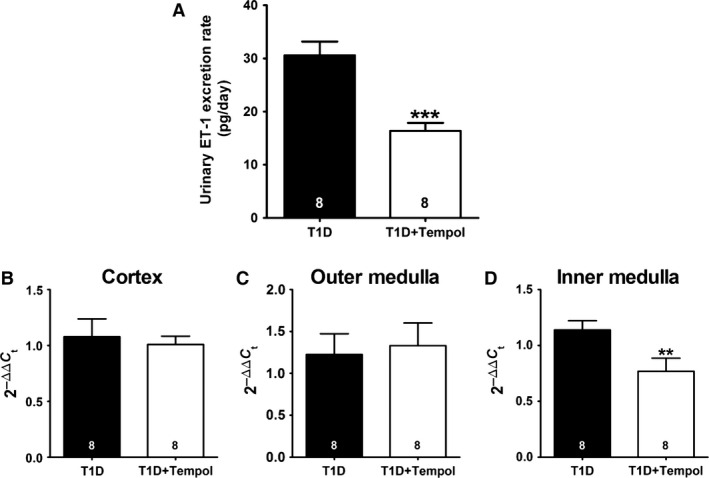
Effect of chronic tempol treatment on the renal endothelin system in rats with type 1 diabetes mellitus (T1D). Shown are urinary endothelin‐1 (ET‐1) excretion (A), and prepro‐ET‐1 mRNA expression measured by RT‐PCR in renal cortex (B), outer medulla (C), and inner medulla (D) for both T1D and T1D+Tempol groups (**P < 0.01 and ***P < 0.001 vs. T1D; number of animals shown at bottom of each bar).