
Figure 4.
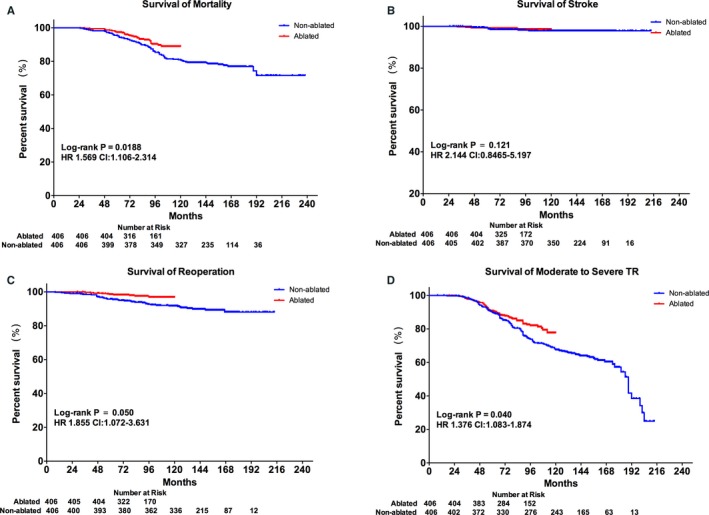
Comparison of outcomes in the PSM cohort. Kaplan–Meier curves of patient survival: overall mortality (A), stroke (B), reoperation (C), and moderate‐to‐severe tricuspid regurgitation (D) in the PSM cohort. HR indicates hazard ratio; PSM, propensity‐score matching; TR, tricuspid regurgitation.