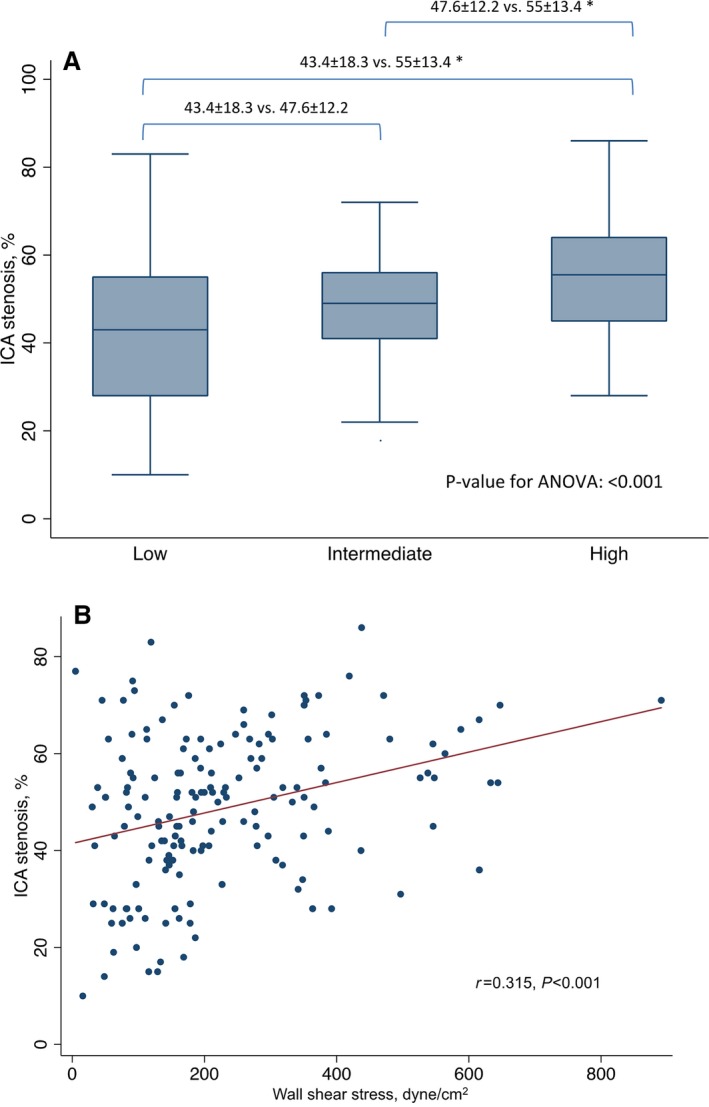
Figure 2.

A, Box plots reporting mean maximal ICA stenosis values according to WSS groups. B, Linear regression analysis of the correlation between WSS and ICA stenosis. *P<0.05. ANOVA indicates 1‐way analysis of variance for continuous variables; ICA, invasive coronary angiography; WSS, wall shear stress.
