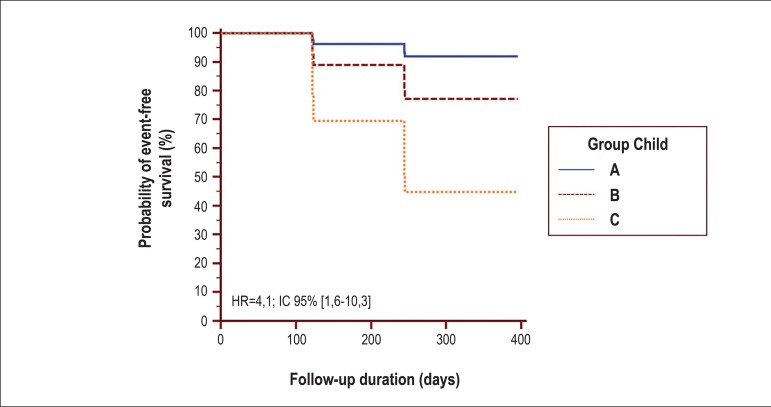
Figure 2.
Kaplan-Meier curves adjusted to the multivariate model of Cox proportional hazards for the groups Child A, B, and C on the composite outcome death and liver transplantation. Risk ratio between Child [C] and Child [A+B] (HR = 4.1, 95%CI 1.6–10.3, p = 0.003). HR: hazard ratio, 95%CI: 95% confidence interval (see Table 3 and text for details).

