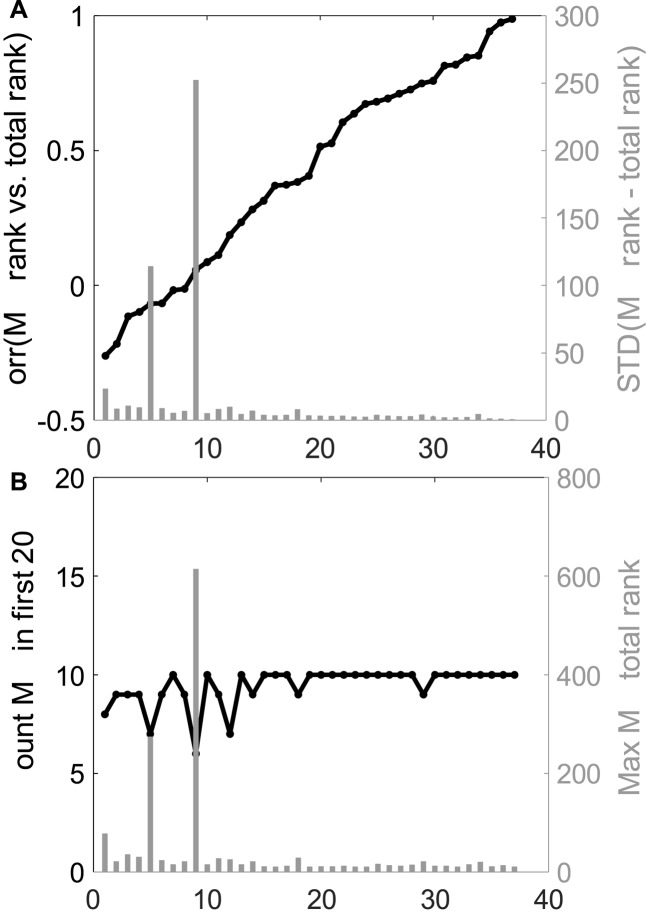
Figure 5.
Inter-source gene set comparison. (A) Left, black: Correlation between MalaCards gene rank vector and the consensus rank; Right, grey: Standard deviation of the difference between the MalaCards gene rank and the consensus rank. (B) Left, black: The number of MalaCards gene disease association in the top 20 consensus rank; Right, grey: The maximal consensus gene rank for a MalaCards gene. Raw data values for each disease are given in Supplementary Table S3.

