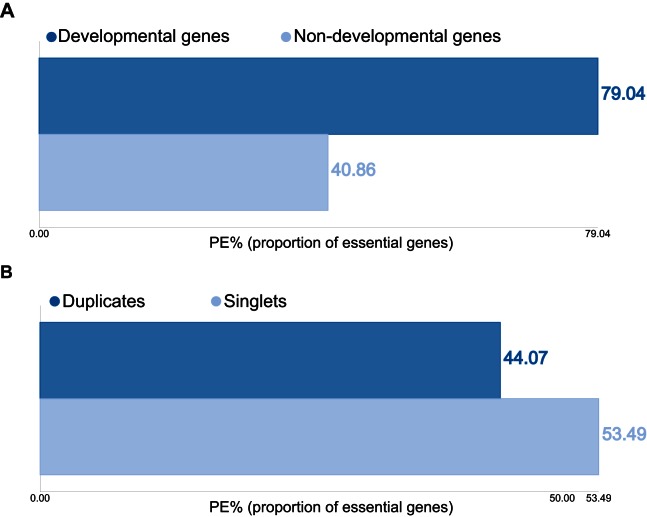
Figure 1.
Screenshots taken from the ‘Analyze’ page. With integrated tools, users can easily analyze the collected data and visualize the results. Shown here are the proportion of essential genes (PE) as a function of involvement in development (developmental versus non-developmental genes, panel (A) and duplication statuses (duplicates versus singlets, panel (B)) in mouse.

