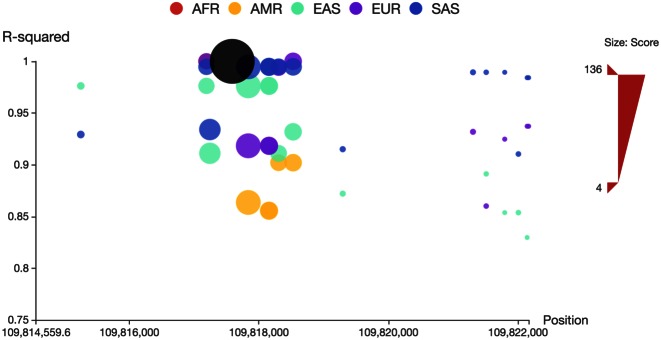
Figure 2.
The regional LD plot of associated SNPs of rs12740374. In the plot, x-axis shows chromosome coordinates, y-axis shows values for r2, the size of the node represents its total score, and associated SNPs in five populations (AFR: African, AMR: Ad Mixed American, ASN: East Asian, EUR: European and SAS: South Asian) are displayed in different colors, and rs12740374 is displayed in black.

