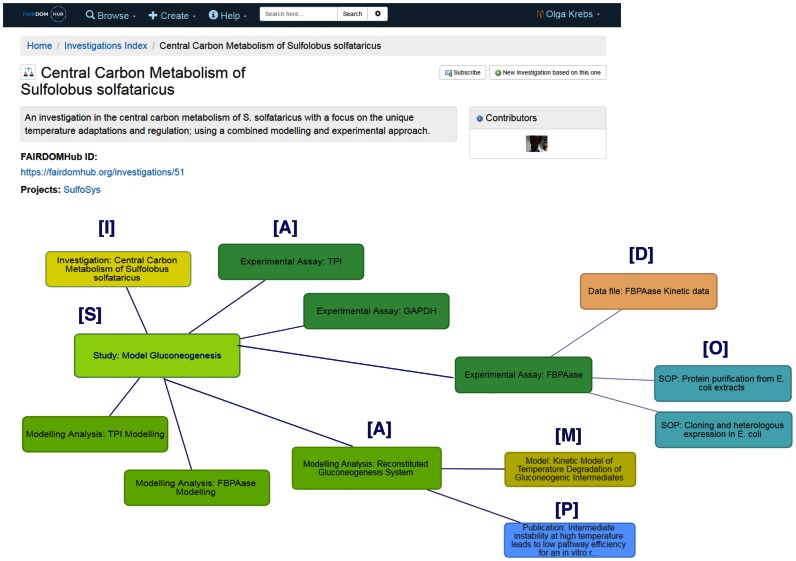
Figure 1.
The FAIRDOMHub interface showing an Investigation into the Central Carbon Metabolism of Sulfolobus solfataricus (12) (https://fairdomhub.org/investigations/51) and the relationships between different assays in one of the constituent studies. The graphical view shows Investigations (I), Studies (S), Assays (A), Data (D), Models (M), Operations (or Standard Operating Procedures-O), and Publications (P). Assays are displayed in two groups; top right shows experimental assays, and bottom left shows modeling assays (analyses). This is a simpler investigation than that of (3) chosen for clarity on the printed page. In practice the interface is designed to be interactive so that users navigate through the graph. Our forthcoming folder-based view will provide an alternative presentation.

