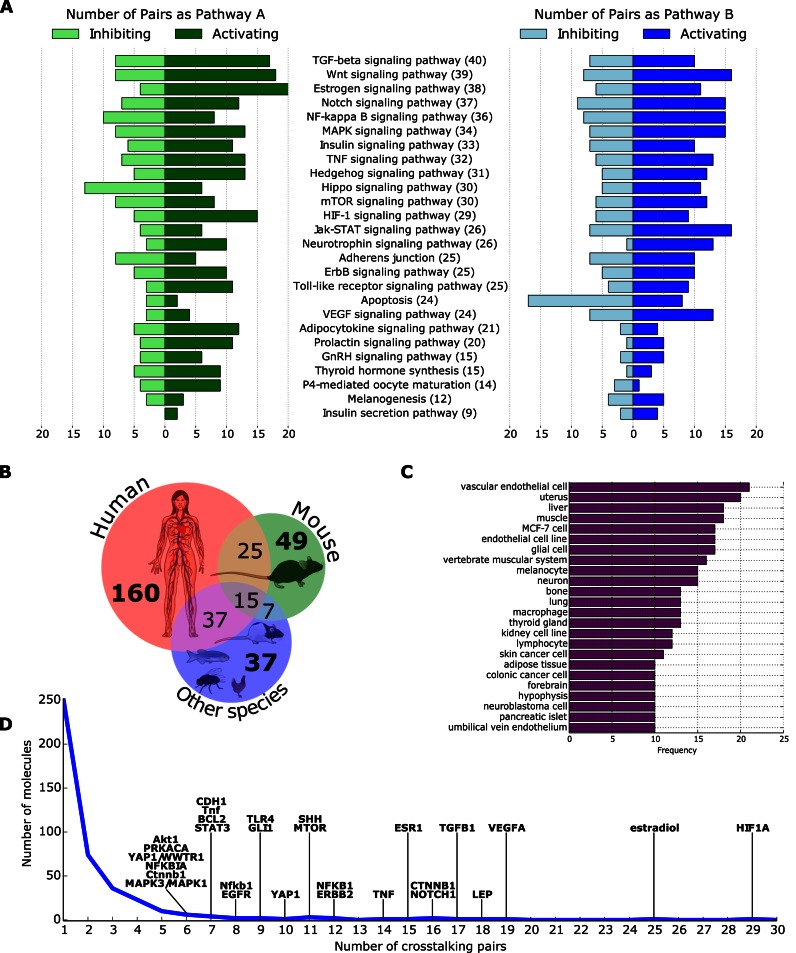
Figure 2.
Statistics summarizing data in XTalkDB. (A) The number of crosstalking pairs in which each pathway participates, either as A (left) or B (right), with activating and inhibiting crosstalk counted separately. The number in parentheses is the total number of crosstalking pairs that include the pathway. Pathways appear in descending order of this number. ‘P4’ is an abbreviation of ‘Progesterone.’ (B) The distribution of the species in XTalkDB. Icons taken from mindthegraph.com under a Creative Commons Attribution Share-Alike 4.0 License. (C) The frequency of Brenda Tissue Ontology terms in XTalkDB. The chart displays only the most specific tissues in the ontology that annotate 10 or more pairs of crosstalking pathways. (D) The distribution of the number of crosstalking pathway pairs mediated by a molecule. We identify the molecules that mediate crosstalk between at least six pairs of pathways. Some of these molecules have similar names (e.g. NFKB1 and Nfkb1) because they belong to different organisms.

