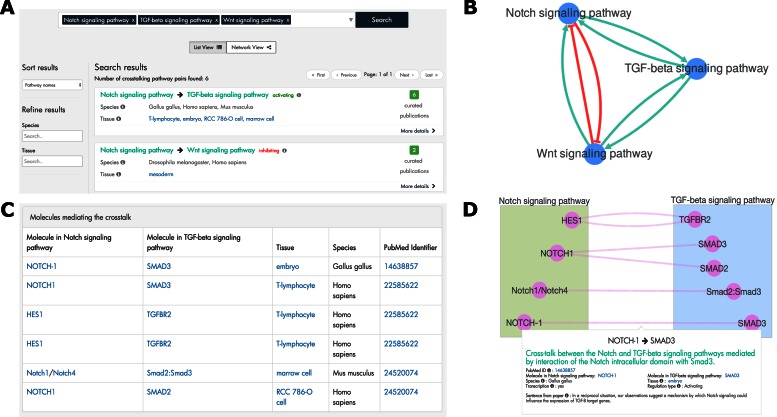
Figure 3.
Screen shots from the XTalkDB website. (A) The List View of the search results for Notch, TGF-β and Wnt signaling pathways. (B) The Network View of the same search results. Green edges with arrowheads represent activating crosstalk and red edges with blunt heads denote inhibiting crosstalk. (C) Molecules mediating the crosstalk from Notch to TGF-β signaling pathway. (D) The network of these molecular interactions. The green and blue rectangles contain the molecules in the Notch and TGF-β signaling pathway, respectively.

