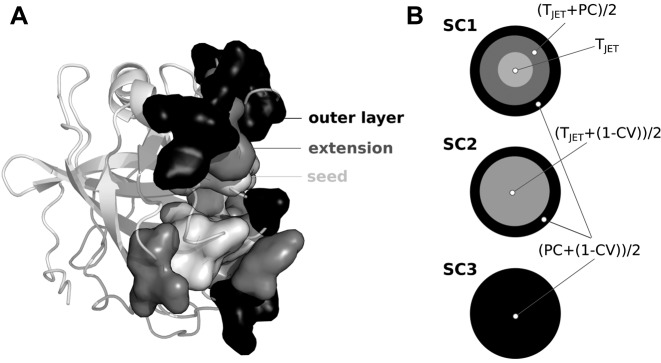
Figure 1.
Predicted interface structure and JET2 scoring schemes. (A) Section of the JET2 prediction of an interface (1N8O). Predicted interface residues are displayed in opaque surface: cluster seed, extension and outer layer are in light gray, gray and dark gray. (B) Schematic icons picturing JET2 scoring schemes. TJET: conservation level, PC: interface propensity, CV: circular variance. Different gray levels correspond to different formulas.

