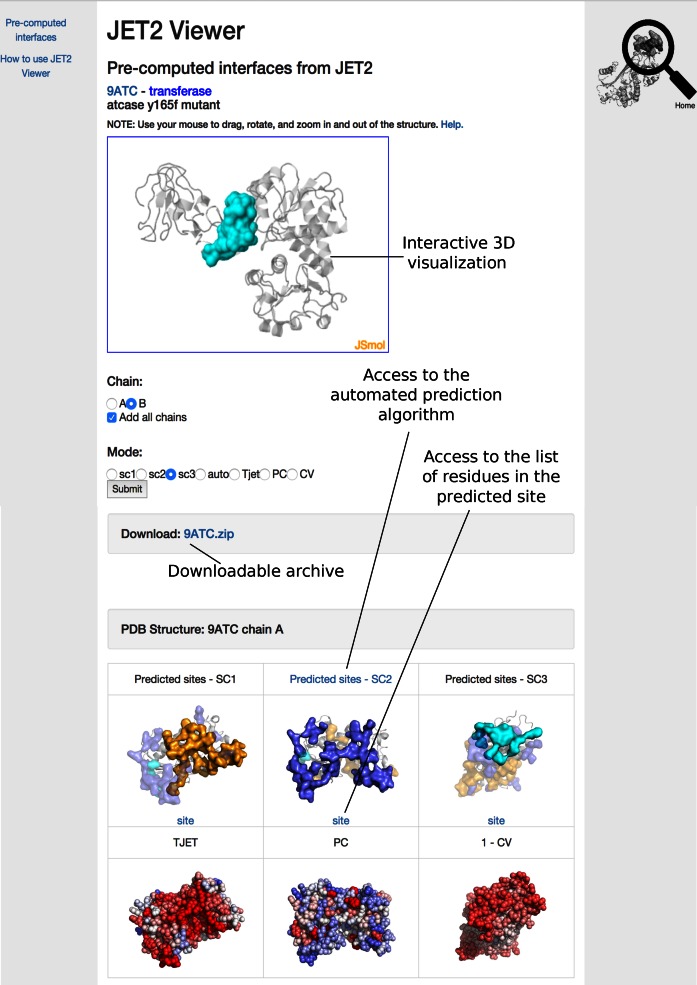
Figure 2.
Example of online JET2 Viewer display. On top, the 3D interactive JSmol plugin shows the site predicted by SC3 for chain B of the PDB entry 9ATC. The two chains, A and B, are displayed as transparent gray cartoons. At the bottom, the sites predicted for chain A with scoring schemes SC1 (orange), SC2 (purple) and SC3 (cyan) are displayed. Each interface is oriented toward the user, and plotted (solid surface) with the other two (transparent). TJET, PC and 1-CV values are also shown for each residue of the protein. Different colors, ranging from red (high) to blue (low), are used to highlight the level of the property for the residue.

