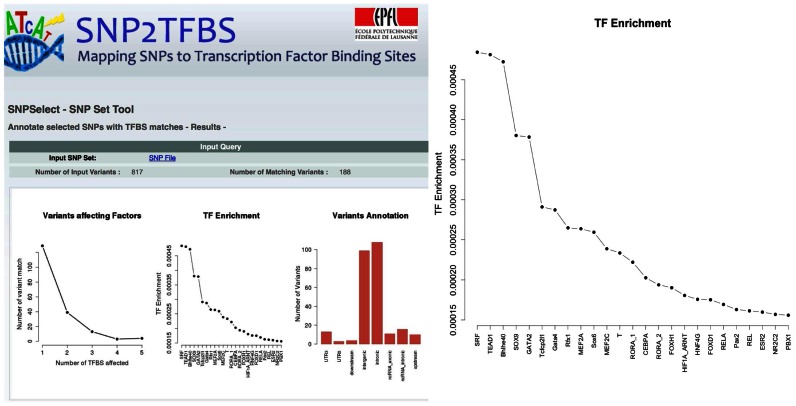
Figure 2.
Example of results page returned by the SNP2TFBS selection and annotation tool. Left side: upper part of the results page with three summary statistics plots. Right side: magnified TF enrichment plot. Input to the analysis was a set of SNPs known from multiple GWAS studies to be associated with diabetes.

