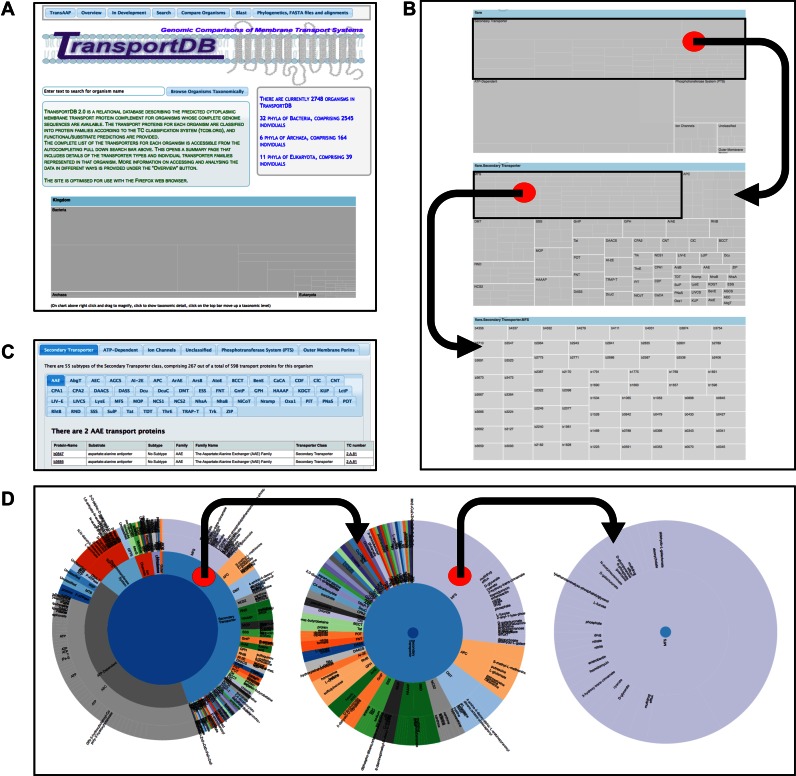
Figure 1.
TransportDB 2.0 home page and core dynamic elements of the organism pages facilitating interactive data access. (A) Screenshot of the TransportDB 2.0 web portal home page. The home page provides an overview of the database and the current database content in both text format and as an interactive zoomable treemap image at the bottom of the page, which operates in the same manner as the organism treemaps (see B). The organism pages can be accessed by typing into the autocompleting search bar, or by following the ‘Browse Organisms Taxonomically’ button. Selecting an organism will open the organism page, which provides a textual overview of the transporter content of that organism, as well as three alternative avenues to view the transporter annotation data for that organism (panels B–D). (B) A zoomable treemap is present in the top right corner of the organism page. At the top level (top panel) the treemap shows transporter classes, clicking in the box for any class (e.g. Secondary Transporter) shows the transporter families or superfamilies within that class (middle panel), and subsequent clicking on a transporter family (e.g. MFS) shows the constituent members of that family (bottom panel). Clicking on any transporter locus tag will open up the annotation evidence for that transporter. (C) The middle section of the organism pages contain nested tabbed lists of all transport proteins within each family and their accompanying details. (D) The lower section of the page shows a zoomable sunburst diagram depicting the distribution of transporter classes in the inner ring, and transporter families in the middle ring, broken down by substrate specificity at the outer ring. As with the treemap zooming in is achieved by clicking on the desired region. Zooming out is achieved by clicking in the centre of the circle.

