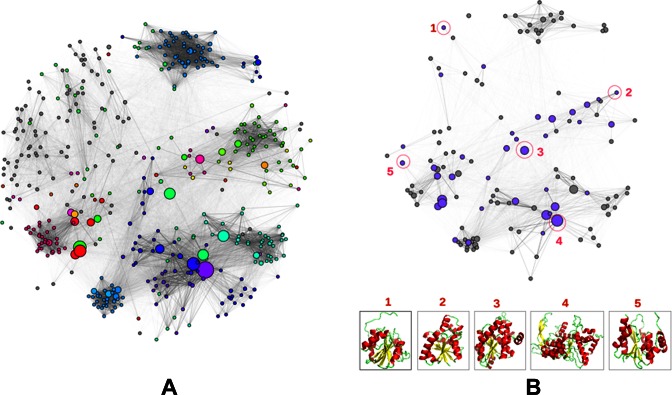
Figure 1.
Visualisation of functional and structural diversity in the HUP superfamily using Cytoscape (25). The nodes in the network represent FunFams and the edges represent sequence similarities between the FunFam HMMs calculated using Profile Comparer (PRC) (16). The size of the nodes (FunFams) reflects their number of sequences and the nodes are linked by edges if the similarity of their HMMs is above a PRC score of 10. (A) This network highlights the functional diversity of the HUP superfamily where all nodes are coloured according to the EC numbers of their constituent sequences and grey nodes indicate those without any EC annotation (including non-enzymes). (B) This network shows the available structure data among the FunFams with high information content in the HUP superfamily. The purple coloured nodes indicate FunFams with known structure and the grey nodes indicate FunFams without any known structure. Structural representatives of selected FunFams (encircled and numbered in red) are shown at the bottom of the figure to highlight the structural diversity of the superfamily.

