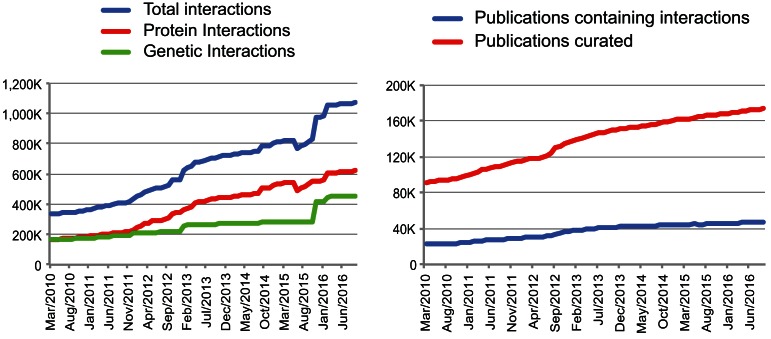
Figure 1.
Increase in data content of BioGRID. Increments in interaction records and source publications reported in BioGRID from March 2010 (release 2.0.62) to September 2016 (release 3.4.140). Left panel shows the increase of annotated protein interactions (red), genetic interactions (green) and total interactions (blue). Right panel shows the number of publications that actually reported protein or genetic interactions (blue) as a function of the total number of publications examined by BioGRID curators (red).

