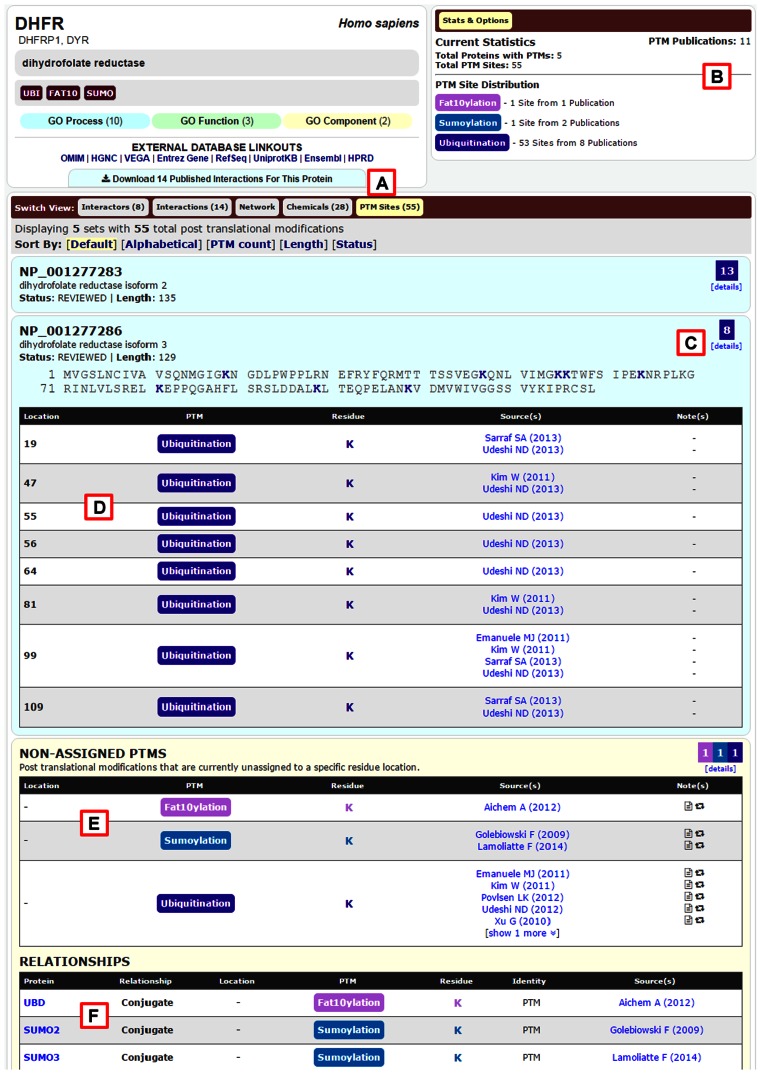
Figure 3.
New BioGRID post-translational modification (PTM) viewer. (A) Users can select the ‘PTM Sites’ tab from the ‘Switch View’ menu to view PTM data when available. (B) The ‘Stats & Options’ box indicates the number of PTM sites and defines the colours assigned to each PTM type. (C) PTM locations are displayed on the protein sequence with modified residues highlighted. (D) Assigned PTM sites are displayed in tabular format with supporting evidence and citations. (E and F) Non-assigned PTMs are displayed at the bottom of the page.

