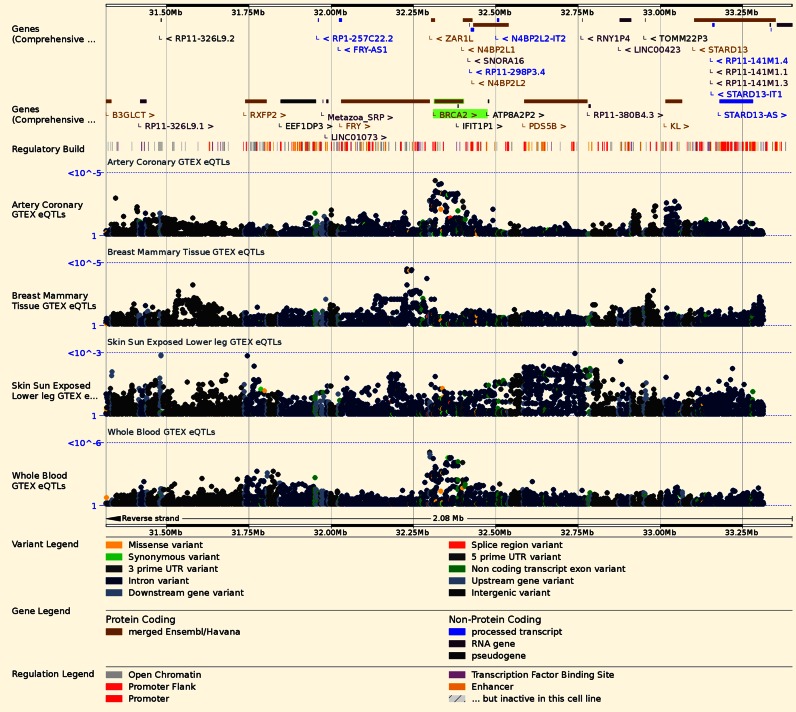
Figure 1.
Regulation view. For each human gene, Regulation view displays correlation statistics (eQTLs) between genetic variation and tissue-specific expression. For BRCA2, data from the GTEx Project are available as Manhattan plots for over 40 tissues, including the four tissues displayed: Artery Coronary, Breast Mammary Tissue, Skin Sun Exposed Lower Leg, and Whole Blood.

