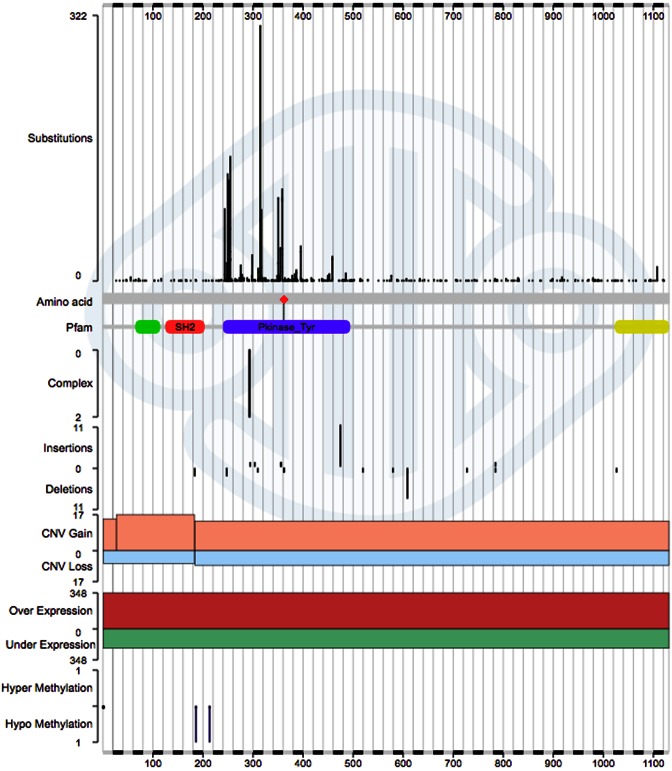
Figure 2.
The main Gene Analysis histogram summarises all mutation content across a single gene, in this case gene ABL1. From top-to-bottom, histograms represent mutation recurrence, at each nucleotide/amino acid position, divided into separate segments for single nucleotide substitutions, multinucleotide substitutions, insertions, deletions, copy number gain/loss, gene over/under-expression and CpG hyper/hypo-methylation. Mutation recurrence across the tyrosine kinase domain (highlighted in purple) indicates that this, when mutated, is the key region driving cancer.

