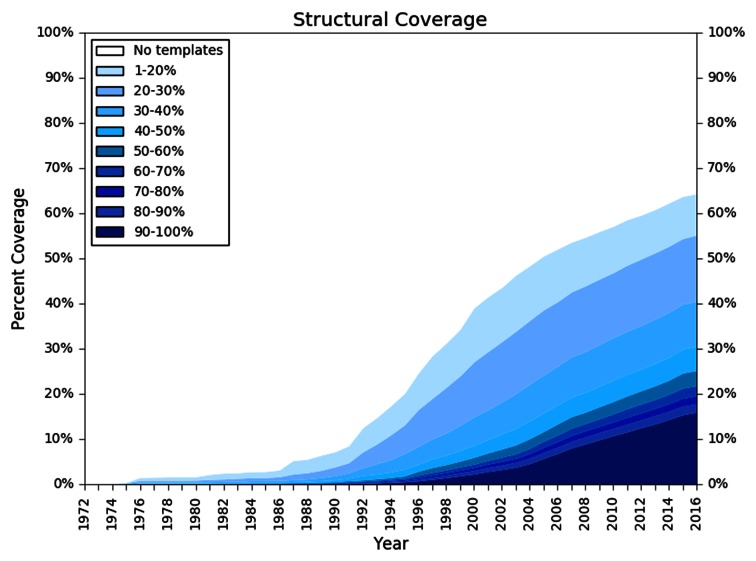
Figure 1.
Structural coverage of the human proteome. The plot illustrates the development of structural information for the amino acids of the Homo sapiens reference proteome residues (y-axis) over time (adopted from (1)). Profiles were generated for each protein sequence in the reference data set based on the NR20 database and used to search the list of protein sequences in PDB using HHblits (16). For each residue, the highest sequence identity for any alignment to an experimental structure available in a given year was recorded. Different colors in the plot represent the quality of the sequence alignment between the reference proteome sequences (targets) and the sequences of the protein structure database (templates). Alignments with low sequence identity are displayed in light blue, whereas alignments with high sequence identity are depicted in dark blue.

