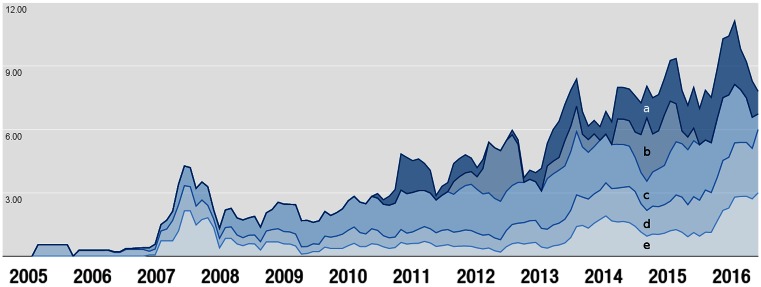
Figure 2.
Increasing complexity of GWAS studies over time (A) number of SNP-by-environment interaction studies, (B) number of SNP-by-SNP interaction publications, (C) number of traits per publication, (D) number of ancestry categories each GWAS publication analyzed and (E) number of GWAS analyses per publication. Values were normalized to provide equal weighting to each category.

