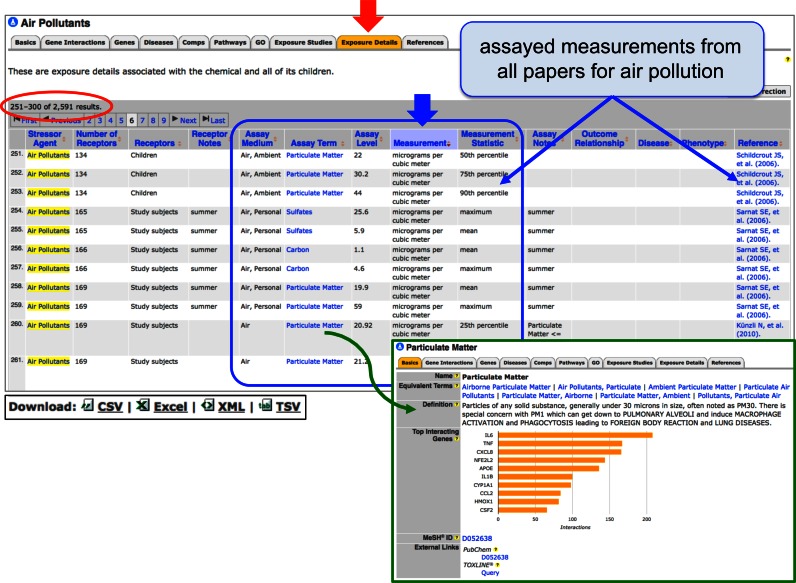
Figure 3.
Landscape view of real-world measurements and outcomes curated for exposure science. The ‘Exposure Details’ data-tab (red arrow) on CTD's chemical page for air pollutants lists 2591 results (red circle) for air pollution markers (e.g. particulate matter, sulfates and carbon), including the type of medium in which the marker was assayed, the units of measurements, the statistics associated with the measurement (blue box), as well as any disease/phenotype outcomes. This view aggregates the data from all germane articles for the chemical-of-interest. Column headers in the table will sort the information by clicking (blue arrow) and embedded terms are hyperlinked to their respective CTD pages (green arrow and green inset box), allowing users to easily navigate to other concepts. At the bottom of every CTD page, a link allows users to download the information onto a desktop in a variety of formats.

