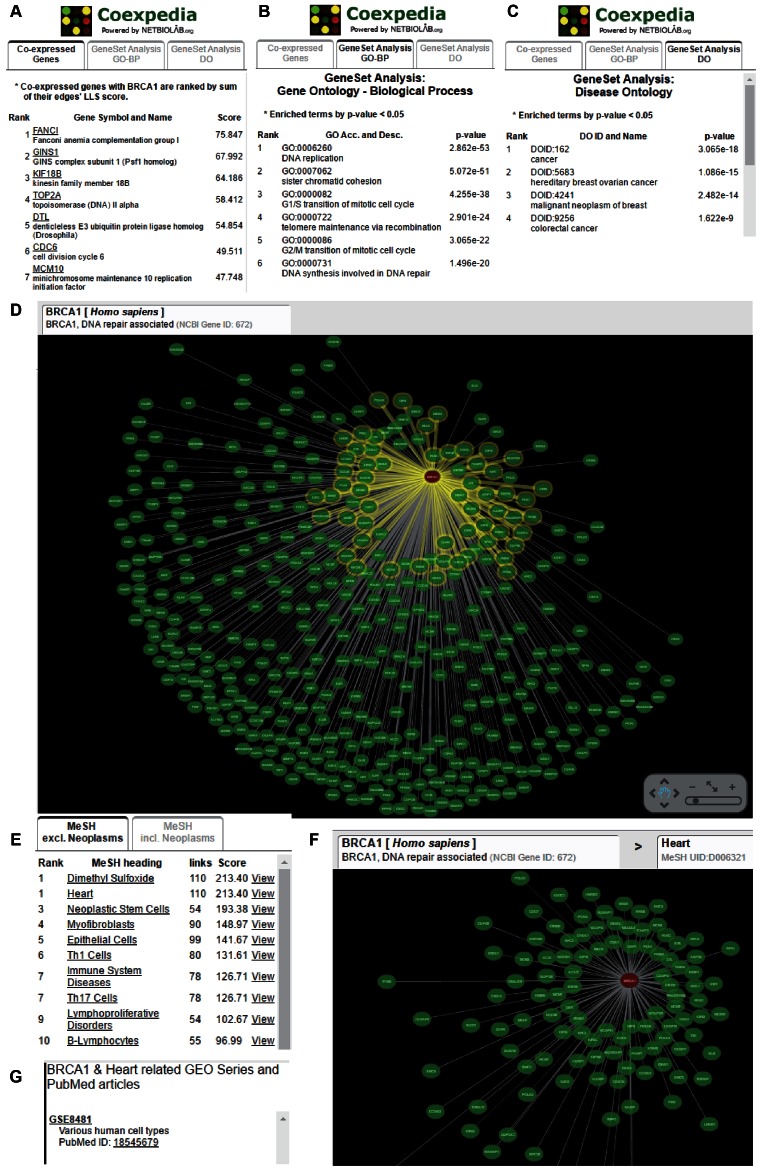
Figure 3.
Screenshots of the BRCA1 query results. (A) A list of the co-expression partners of BRCA1 ranked by the sum of LLS scores. (B) A list of the enriched GOBP terms among BRCA1 co-expression partners ranked by the P-value from Fisher's exact test. (C) A list of the enriched DO terms among BRCA1 co-expression partners ranked by the P-value from Fisher's exact test. (D) A visualization of the gene network of BRCA1 and its co-expression partners. (E) A list of the enriched MeSH terms among the BRCA1 co-expression network. (F) A visualization of the gene network of BRCA1 and its co-expression partners only for the selected MeSH term ‘Heart’. (G) Information on the studies (GSEs and PubMed articles) that support the selected MeSH term ‘Heart’ for the co-expression network.

