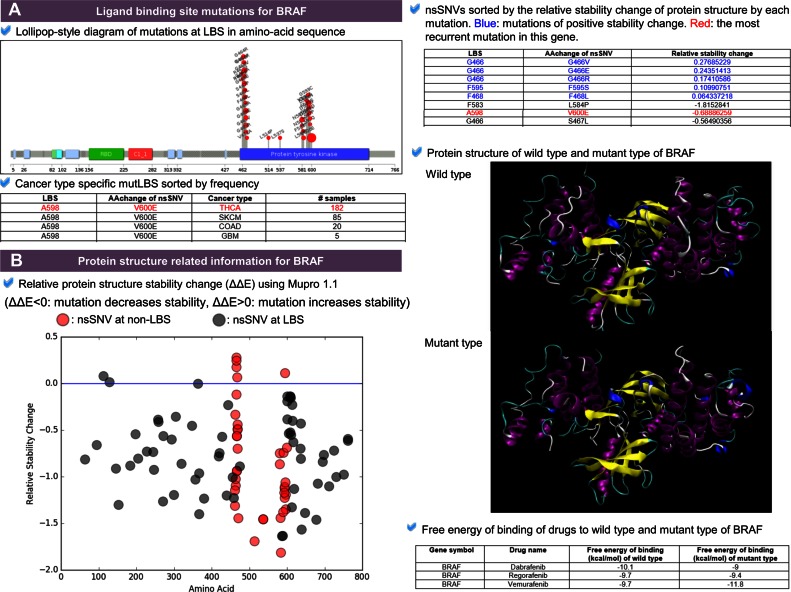
Figure 2.
Ligand binding site mutation information category and protein structure related information category. (A) Ligand binding site mutation information category. The lollipop plot shows non-synonymous single nucleotide variants (nsSNVs) at the ligand binding sites only in amino acid sequence of protein B-Raf. Cancer type specific mutLBS table shows the frequency of each LBS mutation in each cancer type. (B) Protein structure related information category. The dot plot shows the relative protein stability change after occurrence of each mutation. Red dots represent ligand binding site mutations and grey dots for other nsSNVs. This category also shows the predicted protein structure of wild type and mutant protein with their drugs. For the top 20 selected genes, we also calculated the binding affinity.

