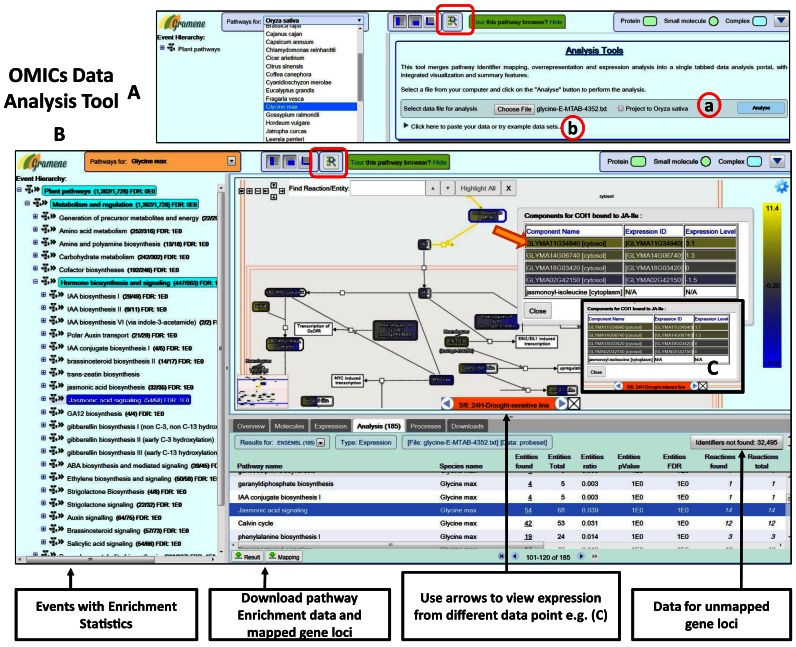
Figure 3.
Plant Reactome pathway analysis tools interface: OMICs data analysis. (A) The analysis tool is accessible from the project website's homepage (http://plantreactome.gramene.org) by clicking on the Analyze Data icon or if the users are on the pathway browser click on the Analyze your data icon (red box). The analysis tools interface replaces the Pathway diagram view in the pathway browser. Users can input their data either by, (a) uploading the data file (this figure) or (b) by copying the data into the text box (Supplementary Figure S3). After selecting the data, click on the Analyze button and the pathway, enrichment analysis data is returned in the tabulated form (B) in the Analysis tab. Select the event from the left-hand side panel to view the diagram with expression data. By hovering the computer mouse over the colored genes sets and clicking the blue info icon a list of mapped entities with painted expression values is displayed. Left or the right arrow next to the orange text box displays expression from a different data column (C).

