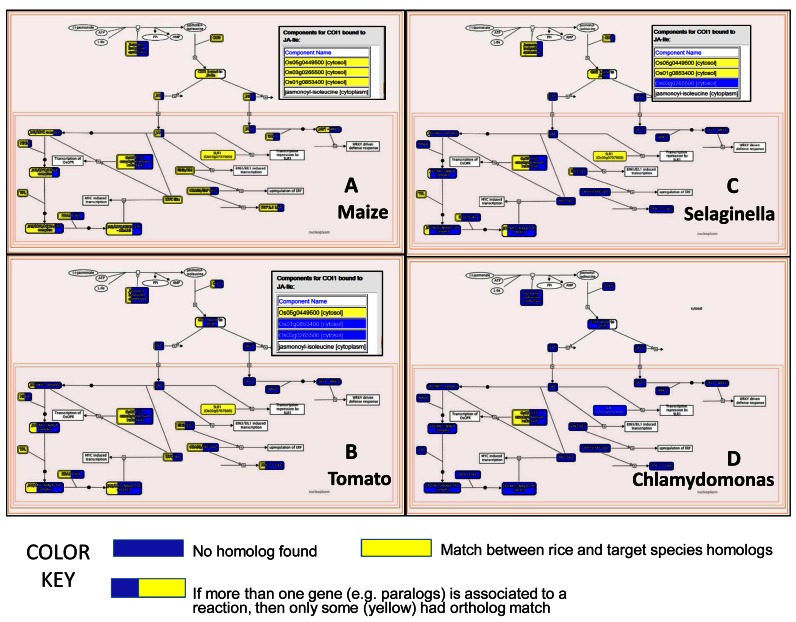
Figure 4.
Plant Reactome pathway analysis tools interface: Interspecific pathway comparative views of the jasmonic acid signaling pathway when compared to angiosperms maize (A) and tomato (B), lycopod Selaginella (C) and unicellular green algae Chlamydomonas (D) based on the respective gene homology matches with the rice reference. Colored boxes suggest that either a respective rice gene homolog was found (yellow color) or not (blue). The reaction associated with multiple rice genes may display both yellow and blue colors depending on the number of homolog matches which also corresponds to the proportion of the yellow or blue color. The inset showing Components for COI1 bound to JA-Ile suggests which of the rice genes have homologs mapped from the respective species.

