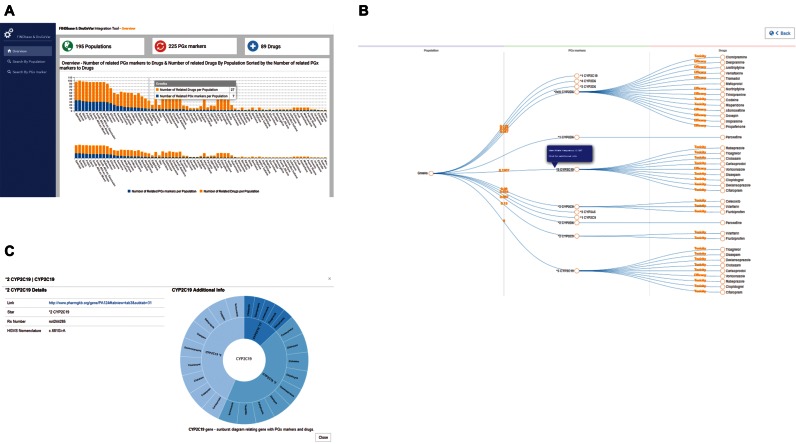
Figure 1.
Integration of DruGeVar with the PGx markers data module of FINDbase. (A) Bar chart showing the number of the related PGx biomarkers to drugs and the number of related drugs by population sorted by the number of related PGx biomarkers to drugs. The subchart is used for selecting specific region of the bar chart. (B) Collapsible tree diagram showing the relation between population, PGx biomarkers and drugs. The number between population and PGx biomarker defines the rare allele frequency and the label between PGx number and drug the effect on the toxicity or efficacy of the biomarker to the related drug. Clicking on the nodes of PGx biomarkers or drugs additional information for the selected element is appearing in a pop up window. (C) Pop up window showing additional information for the selected PGx biomarker. Left: Details for the selected PGx marker. Right: Sunburst visualization, showing the related additional PGx markers and drugs of the gene of the selected PGx biomarker. Clicking on the elements of the PGx biomarkers, the visualization is reconstructed focusing on the children nodes (related drugs) of the selected node, while clicking on the elements of the drugs, the visualization is reconstructed focusing on the ‘children’ of the parent node.

