Figure 3.
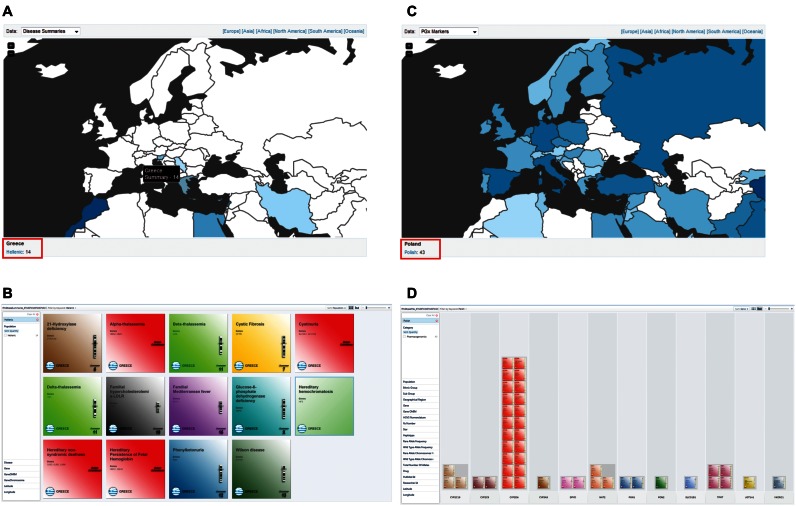
Overview of the new FINDbase map display visualization tool. (A) Overview of the documented genetic disease summaries in European countries (part of North Africa is also shown). By hovering the cursor over Greece, a text box appears providing an overview of the number of disease summaries documented in FINDbase for the Hellenic population. By clicking on the country, a link appears in the bottom down part of the map (indicated in a red rectangle). Clicking on the link opens a new browser page, where all the different genetic disease summaries in the (B) Hellenic population appear, where the user can navigate for further information. (C) Overview of the documented PGx markers in European countries (part of North Africa is also shown). Again, by clicking on a specific country (e.g. Poland), a link appears in the bottom down part of the map (indicated in a red rectangle), which opens a new browser page, where all the different PGx markers in the Polish population appear, (D) grouped per gene. Please note that the intensity of the blue color is indicative of the number of data records that are documented in FINDbase for every country per data module, respectively (see also Supplementary Figure S4).

