
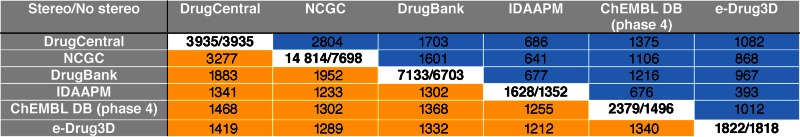
Table 2. Structure overlap between 3935 DrugCentral structures (MOL V2000 subset) and other small molecule drug databases. The upper triangle (blue) summarizes the APIs overlap calculated using stereo chemistry information. The lower triangle (orange) contains overlaps determined with stereochemistry omitted. The Diagonal entries represent number of unique molecular structure records before and after removal of salt/solvent, or invalid/duplicate records.
|