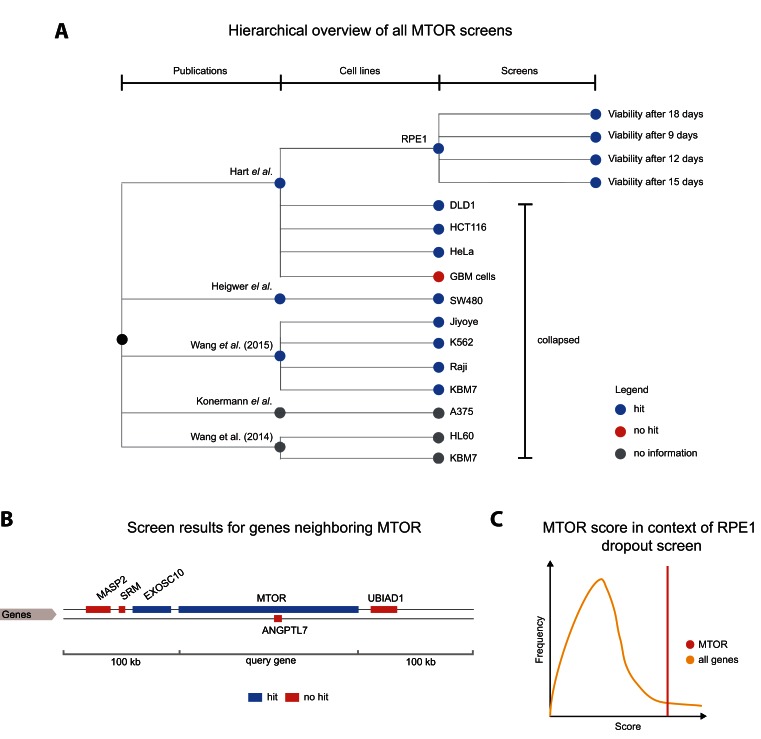
Figure 2.
Overview of all screens featuring a perturbation of MTOR. (A) A tree visualization shows published results across three levels of detail. An inner node represents a publication in scientific literature. Every publication node has a child node for each cell line used for experiments. The leaves of the tree illustrate different experimental conditions. Blue nodes imply that MTOR was identified as a hit in the experiment. Red nodes and gray nodes show that MTOR was not a hit, or that no hit information was provided by authors, respectively. In this example, RPE1 and SW480 cell line nodes have been expanded to show all performed experiments. (B) Results for all genes in the ±100 000 base pair neighborhood of MTOR. Blue and red colors depict hits and non-hits, respectively. (C) Hovering over one of the terminal nodes (to the right) triggers a ‘score in context’ figure. This cartoon represents the strength of the genes phenotype (score) in the context of all genes screened in this experiment. So the user can quickly judge upon the certainty of the hit identification.

