
Figure 2.
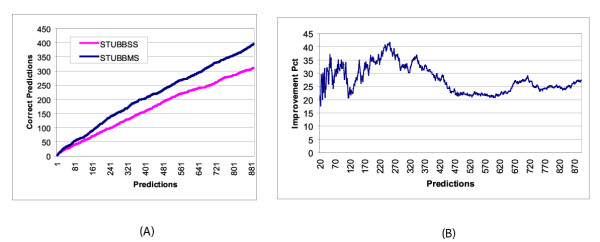
(a) Effect of two-species data on performance, using a less stringent evaluation method than in Figure 1. The x-axis is the number of predicted CRM's, restricted to those for which at least one of the two nearest genes has expression information. A prediction is deemed "correct" if either of its two nearest genes has a blastoderm-specific pattern. (b) The increase in number of correct predictions from STUBBSS to STUBBMS, as a percentage of the correct predictions made by STUBBSS.