Figure 5.
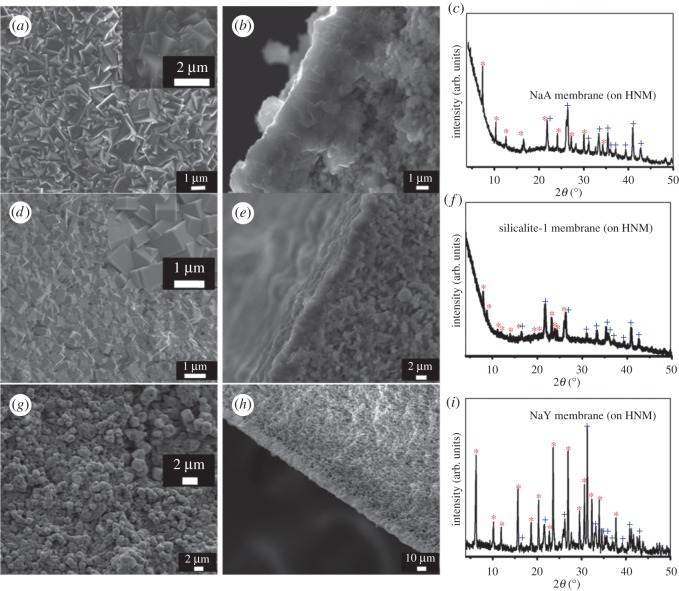
(a) SEM top view image, (b) SEM cross-sectional image and (c) XRD pattern of the zeolite NaA membrane; (d) SEM top view image, (e) SEM cross-sectional image and (f) XRD pattern of the zeolite silicalite-1 membrane; (g) SEM top view image, (h) SEM cross-sectional image and (i) XRD pattern of the zeolite NaY membrane. Diffraction peaks of zeolite phases were marked with asterisks, and diffraction peaks of HNMs were marked with crosses.

