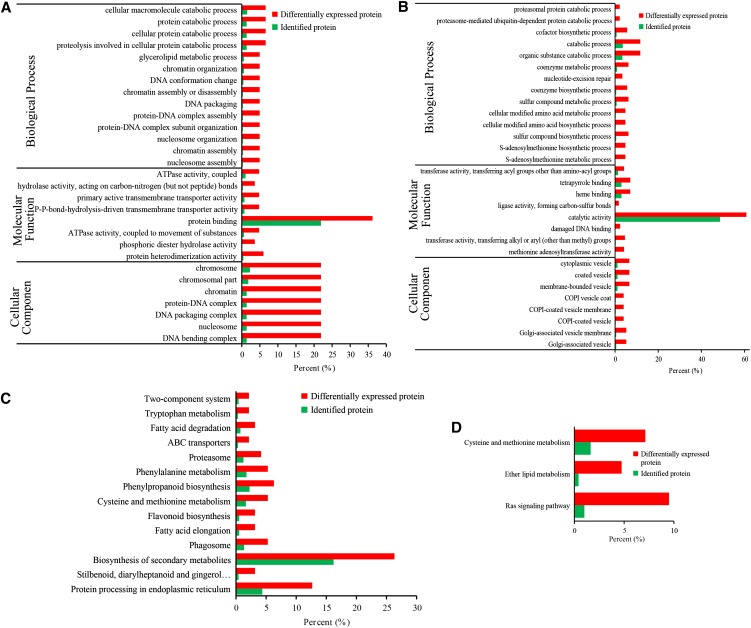
Figure 3.
Functional enrichment analysis of proteins with up-regulated and down-regulated Kub sites. A and B, GO-based enrichment analysis of proteins with up-regulated (A) and down-regulated (B) Kub sites. C and D, KEGG pathway-based enrichment analysis of proteins with up-regulated (C) and down-regulated (D) Kub sites. The percentage of differentially expressed proteins indicates the ratio of the mapping proteins to all mapping proteins. The percentage of identified proteins indicates the ratio of the background proteins to all background proteins. The significance level was set at P < 0.05 (Fisher’s exact test). These data come from Supplemental File Exc S7.

