Figure 7.
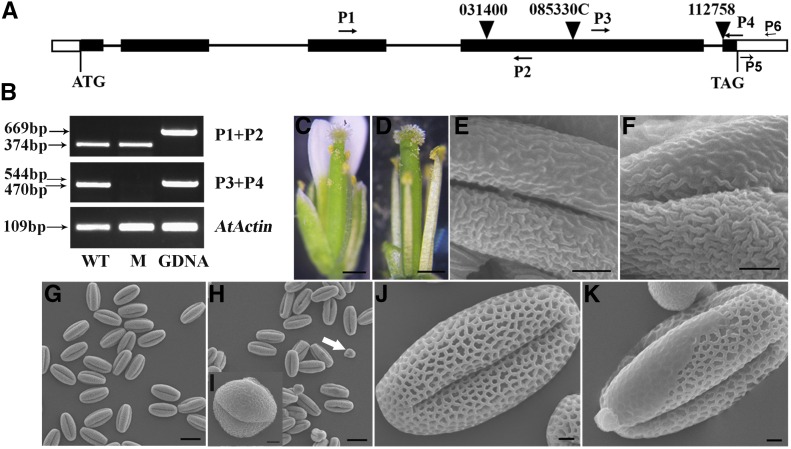
Phenotypic analysis of a T-DNA insertional line of the IPE1 orthologous gene in Arabidopsis. A, Gene structure and the position of the T-DNA insertion in AT1G12570. B, Reverse transcription (RT)-PCR analysis with the primers shown in A. Amplification occurred with primers P1+P2 in the T-DNA insertional line but failed with primers P3+P4. AtACTIN was used as a positive control. WT, Wild type; M, T-DNA insertional line; GDNA, genomic DNA. C and D, The pollen grains of the wild type (C) and the T-DNA insertional line (D) are observed. E to K, SEM analysis of the wild type and the T-DNA insertional line. E and F, The normal anther surfaces of the wild type (E) and the T-DNA insertional line (F) are shown. G and H, Smaller pollen grains appeared in the T-DNA insertional line (arrow; H) compared with the wild type (G). I, Magnification of a smaller pollen grain. J and K, A few limited areas without a visible exine network were detected in the T-DNA insertional line (K) compared with the wild type (J). Bars = 500 μm in C and D, 2 μm in E, F, and I to K, and 20 μm in G and H.

