Figure 5.
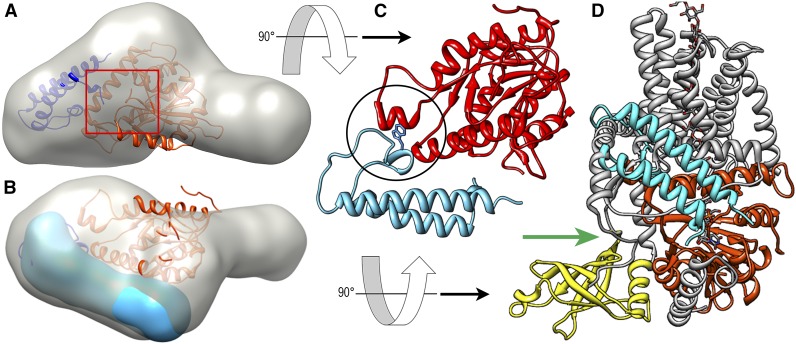
Best-fit models of the P-CR in the OsCesA8 CatD. A, The P-CR fit in the three-dimensional molecular envelope of the CatD (gray; Olek et al., 2014) using MIFit (https://github.com/mifit/mifit). The CatD homology model (orange) and P-CR crystal structure (navy blue) are shown in their best fit, which places the N terminus of the P-CR near the junction with the catalytic core (red square). B, Rotated view shows the three-dimensional molecular envelope of the P-CR (blue) overlaid in the best-fit orientation. C, A potential hydrophobic contact with Trp-432 (stick) between the catalytic core and the P-CR LP region (black circle), illustrated here with P-CR (light blue) and the OsCesA8 CatD homology model (red). D, The CatD homology model alignment with the BcsA P-CR coiled-coil (light blue) is overlaid onto the BcsA crystal structure. CesA homologous regions (orange) and nonhomologous regions (gray) place the termini near the substrate entry pathway of BcsA (green arrow; Morgan et al., 2013, 2014). The position of the BcsA PilZ domain (yellow) does not overlap that of the P-CR, which is found on the opposite side of the catalytic core domain.

